Thursday, February 24, 2022

Introduction to Options

What is an Option?

 Options are not to be confused with futures, as they are two separate financial instruments.

The option seller has the corresponding obligation to fulfill the transaction – to sell or buy – if the buyer (owner) ‘exercises’ the option. The underlying asset/instrument could be a stock, bond, foreign currency, commodity, or any other traded instrument. Exercising means utilising the right to buy or sell the underlying security. 

Usually, an option contract should include the following specifications:

Type: whether the option holder has the right to buy (a call option) or the right to sell (a put option).

  • Underlying asset and  quantity: the quantity and the underlying asset(s) (e.g.: 100 shares of Apple.Inc stock)
  • Strike price: the stated price where the buyer will exercise the option
  • Expiry date: the last date the option can be exercised
  • Settlement terms: for instance, whether the option seller (writer) must deliver the actual asset on exercise, or whether he/she will simply tender the equivalent cash amount
  • Option premium: the total amount you pay for the option.


Why Use Options?

There are two types of options: Call and Put. Call options allow the owner to buy a specified amount of underlying asset at a fixed price within a specific period of time while put options allow the holder to sell a specified amount of underlying asset at the strike price within a specific timeframe.

An option can also be categorised by American or European style. American options can be exercised any time before the expiration date of the option, while European options can only be exercised on the expiration date. When you buy an option, the purchase price is called the premium. If you sell your option, the premium is the amount you receive. The premium isn’t fixed and may fluctuate based on market conditions. 

Aside from providing investors with the right to buy or sell underlying assets, there are various use cases for options1:

Versatile securities

The advantage of options is that you are not limited to making a profit only when the market goes up. Because of the versatile nature of options, you can also make money when the market goes down or even when it moves sideways.

Speculation

If you buy an options contract, you are betting on the movement of the security. This kind of bet requires extensive knowledge of financial markets and a high risk tolerance.

Hedging

Options are used as an insurance policy to protect your stocks against a potential downturn.

Options to attract employees

Many companies use stock options as a way to attract and keep talented employees.

Different Types of Options

As mentioned before, the strike price for an option is the price at which the underlying asset is bought or sold if the option is exercised. The relationship between the strike price and the actual price of a stock determines, in the unique language of options, whether the option is in-the-money (ITM), at-the-money (ATM) or out-of-the-money (OTM)2.


In the money (ITM)

For call options, in-the-money means that strike price is below the actual stock price. 

Example: An investor purchases a call option at the $95 strike price for XYZ that is currently trading at $10. The investor’s position is in the money by $5. The call option gives the investor the right to buy the equity at $95. 

For put options, in-the-money means that strike price is above the actual stock price. 

Example: An investor purchases a put option at the $110 strike price for XYZ that is currently trading at $100. This investor position is in-the-money by $10. The put option gives the investor the right to sell the equity at $110.

At the money (ATM)

For both put and call options, the strike and the actual stock prices are the same.

Out-of-the-money (OTM) 

An out-of-the-money call option strike price is above the actual stock price. 

Example: An investor purchases an out-of-the-money call option at the strike price of $110 for XYZ that is currently trading at $100. This investor’s position is out-of-the-money by $10. An out-of-the-money put option strike price is below the actual stock price. 

Example: An investor purchases an out-of-the-money put option at the strike price of $95 for XYZ that is currently trading at $100. This investor’s position is out of the money by $5.

Payoff

You have now familiarised yourself with option basics. Now, let’s take a look at how option works and how the payoff can be derived. Payoff diagrams are charts that illustrate the profit/loss of the option as its underlying price changes, and the conditions include: long-call, short-call, long-put, and short-put.

Long-Call

Bob is bullish on Apple Inc. because he believes the new iPhone will have more functions and  will subsequently give the stock a good bump. Rather than buying shares, Bob is looking at a long position with call options, as they limit his downside while  still allowing unlimited gains if the stock price blows up. Here are some facts about his position and what the payoff will look like at various stock prices:

Given: option premium per share = $2, option strike price=$100

The breakeven point is the stock price at which an investor’s net profit will be zero:

Breakeven stock price = Strike price + premium

In this case, the breakeven price is $100 + $2 = $102. Another feature to note is that if the stock price is below the strike price, Bob will just let the options expire without using them and his losses will be limited to the premium he paid for the options. On the other hand, the profits are unlimited as the price goes higher than $102. 

Here is a formula:

Call payoff per share = MAX (stock price – strike price, 0) – premium per share

At a stock price of $98, MAX ($98 – $100, 0) – $2 = 0 – $2 = $2 per share loss

At a stock price of $105, MAX ($105 – $100, 0) – $2 = $5 – $2 = $3 profit per share

Short-Call

The writer (seller) of the call option takes a short or opposite position. His payoff graph is the opposite of the long-call we mentioned. Profits are limited to the premium he collects when the strike price exceeds the stock price and the calls are allowed to lapse. Above the strike price he faces increasing losses as the stock price increases. 

The payoff formula is:

Short call payoff per share = premium per share – MAX (0, share price – strike price)

Long-Put

In this circumstance, Bob is bearish on Apple.Inc stock as he feels that the new iPhone may be overhyped due to public anticipation. He might therefore buy a long-put option of Apple stock, through which he gains interest as long as the stock price drops below the breakeven price. His loss is also limited to the paid premium and the gain can reach a maximum when the stock price drops to 0.

Given: option premium per share = $2, option strike price=$100

Breakeven stock price = Strike price – Premium

In this case, the breakeven price is $100 – $2 = $98. If the stock price is above the strike price, Bob will just let the options expire without using them and his losses will be limited to the premium he paid for the options. On the other hand, his profits are also limited as the price can go lower than $98 and reach the maximum when the price is zero. 

Here is a formula:

Put payoff per share = MAX (strike price – stock price, 0) – premium per share

At a stock price of $103, MAX ($100 – $103, 0) – $2 = 0 – $2 = $2 per share loss

At a stock price of $95, MAX ($100 – $95, 0) – $2 = $5 – $2 = $3 profit per share

Short-Put

The writer (seller) of the put option takes a short or opposite position. His payoff graph is the opposite of the long-put position illustrated above. Profits are limited to the premium he collects when the stock price exceeds the strike price and the put options are allowed to lapse. Below the strike price he faces increasing losses as the stock price decreases. 

The payoff formula is:

Short put payoff per share = premium per share – (MAX (0, strike price-share price)


Tuesday, February 22, 2022

What is the Crypto J-Curve?


What is the Crypto J-Curve?

crypto J curve

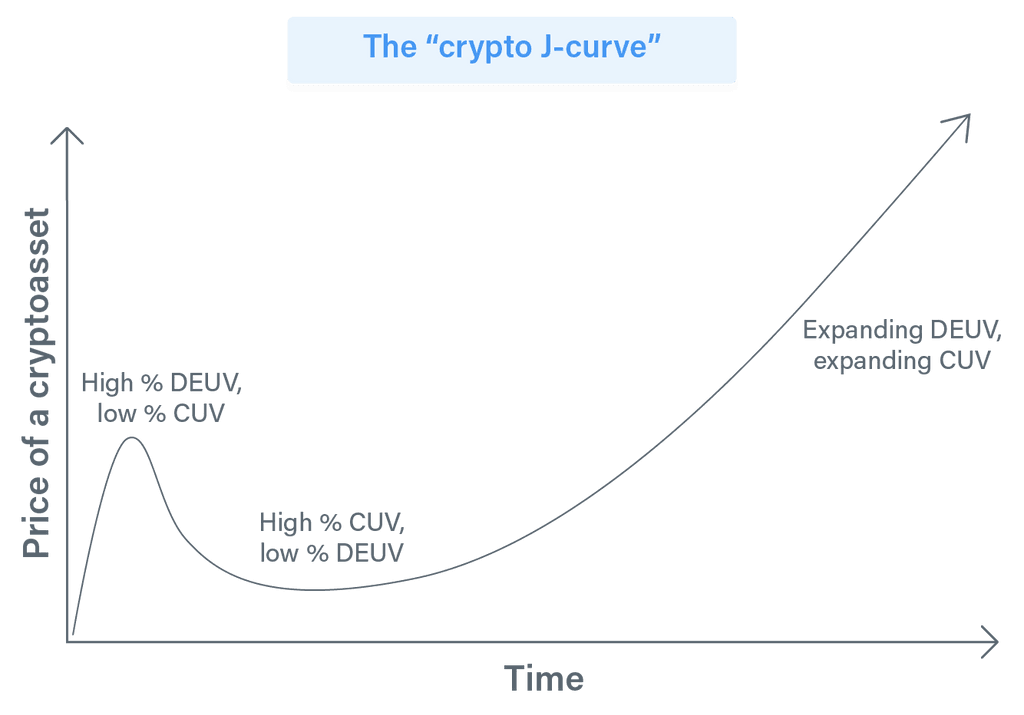
The crypto J-curve models how the market values a cryptocurrency over time. Usually, upon an ICO, or its initial listing on a major exchange, enthusiasm for a crypto asset is high. It typically continues to moon (or boom) for a while. Yet, during this time, the utility value of the coin is usually minimal, or even non-existent.

As the coin gets utilised by others, potholes in the road appear, which the developers tried to patch up as quickly as possible. But enthusiasm wanes, and with that the value of the coin. However, as improvements are made to the protocol, things tick up again, drawing out a pattern in the shape of a ‘J’.

We introduced the equation of exchange in the post on crypto asset valuation. This model was conceived by Chris Burniske. However, he didn’t stop there and has extended the model further to form the ‘Crypto-J-curve’ hypothesis.

Let’s go into this step by step so that you can understand how market sentiment influences the value of your crypto assets.

Step 1: Utility Management

Burniske uses the discounted present value to measure the token utility. He assumes a specific maturity date, T, then proxies the token utility value by that date (in USD), finally discounting it back to today.

Readers should note that the utility measurement itself is futuristic. Future? Come again, Marty: In other words, if the token’s utility is considered immature today, we should consider its future utility and discount it back to get a fair valuation for its current price.

Step 2: CUV and DEUV, and What They Are

Burniske further decomposed the token price into ‘Current Utility Value’ (CUV) and ‘Discounted Expected Utility Value’ (DEUV).

The idea is that a token’s value consists of both:

  • the value as if it can be used today
  • the value as if it will be widely adopted in the future

The Crypto J-Curve in Action

Burniske believes that the enthusiasm for a crypto asset will initially be high and typically continues to grow for a while. In this period, the CUV of the asset is minimal, or non-existent if there’s no protocol. The asset is then largely composed of DEUV.

As the crypto assets progress through time, the enthusiasm may wane, weighing on the DEUV. Since the system is not yet mature, the CUV is low, and a high % of CUV presents a low valuation price.

The system will gradually mature with increased use, and the CUV of a crypto asset grows quietly. A growing CUV can occur even as the DEUV of the token continues to compress. If the market is bearish enough, the price of the asset may compress DEUV all the way to zero, leaving only CUV, and a drastically diminished price. Potentially, the market may even discount the asset to the point of trading below CUV, somewhat akin to a stock trading beneath book value.

The system will eventually reach a mature point where both CUV and DEUV are expanding, completing the whole market cycle.

Although the valuation model and the Crypto-J-curve provides a practical framework for analysing crypto assets, we would like to point out some problems and concerns with the model:

1. Arbitrary maturity date chosen

In Burniske’s example, he has used 30 years as maturity date. What if the token is more short or mid term focused? With a high discount rate (e.g. 30%), picking 10 years vs 30 years can significantly affect the result due to discounting.

2. Only single use case are allowed

Burniske assumed only one use case in his example. What if the token has more than one utility or use case?

3. It is hard to measure utility value in USD

Many arbitrary assumptions were introduced, including target addressable market and adoption curve.

4. An arbitrary discount rate

The discount rate has significant impact on the discounted utility, yet no sound methodology for calculating the discount rate is provided. Burniske subjectively picks 30% as the discount rate in his example.

5. Technological soundness is not considered

No factors are considering the technological soundness/platform and team capabilities.

6. The probability of failure

Projects may fail due to technology, execution, accidents, etc.

Is the Crypto J Curve Useful?

To conclude, Burniske provided one of the first crypto asset valuation models, which may provide directional insights for token valuation. It won’t give you a good estimate for exact token prices, but it has use as as a general roadmap for a token’s development.

How to Fully Understand the Value of Your Crypto

This post on the Crypto J-Curve completes a four-part series we created on cryptoasset valuation. You can also learn the 101 of crypto valuation, TradFi asset valuation tools, and other cryptoasset valuation models in the other pieces of our series for a deep dive and DYOR (do your own research) on what your crypto is really worth.

Monday, October 25, 2021

Meme Coins

Dogecoin, the first meme-coin, launched in 2013, was once considered an ironic gimmick and has now gained quite a reputation, becoming the 10th largest cryptocurrency with a $32.54 billion market capital on October 19, according to CoinMarketCap.

However, the pioneering meme currency has faced stiff competition from Shiba Inu and other floki-themed coins. So what's the fuss about these new floki coins? But first, let's understand what meme coins are.

Meme coins are cryptocurrencies, inspired by popular social media jokes, sarcasms and puns.

Currently there are about 124 meme coins, according to the Coinmarketcap website. Dogecoin's success in 2021 burgeoned the birth of many more meme coins imitating Doge.

* Meme coins are created with no specific use or inherent value, to gain quick high profits. In comparison, mainstream cryptocurrencies like Bitcoin are created with specific technology to boost trading and transactions in the crypto market.

* They are way more volatile than other cryptocurrencies as whales can lead to sudden rise and fall in their prices.

* For instance, Shiba Inu rose 230 per cent in 7 days following the sale of 6.3 trillion Shib tokens in the first 2 days of October.

* Their performance and fame are mostly linked with social media support and hype created by their influencers and they are highly community-driven.

* Many meme coins have unlimited stock that have a long-term impact on their prices.

* These coins are launched quickly, meaning they can be lost in the long term.

* According to the CoinMarketCap website, DogelonMars, MonaCoin and HogeFinance are among the top 10 cryptocurrencies in terms of market capital after Dogecoin and Shiba Inu on October 19.

Floki-themed cryptocurrencies

Floki- themed cryptocurrencies are dog-meme coins with the name Floki created after Elon Musk tweeted to name his Shiba Inu dog Flokifrunk on June 25. Some of the floki-themed coins include Shiba Floki, Floki Shiba, Flokinomics, Floki Inu and Baby Floki Inu.

Dogecoin-killer

Shiba Inu was launched in 2020 as a self-proclaimed killer of Dogecoin and aims to become an Ethereum-based substitute of Doge.

* Shiba Inu was created by a pseudonymous founder Ryoshi Inu.

* The meme coin was created to capitalize on the soaring popularity of the leading Dogecoin.

* The meme-coin has the second highest market capital of $11.12 billion after Dogecoin on October 19, according to CoinMarketCsp.

* It has three tokens namely Leash, Bone and Shib and it's retail demand has increased since the initial listing.

Shiba Inu was recently listed on India's oldest crypto exchange ZebPay on October 13 for trading and investing.

The triggering effect of the tweets

Though tweets are not meant to be taken as a price determinant for cryptos, Musk's tweets have been seen to trigger the prices of the meme coins since the Dogecoin days.

* The very famous tweet of sending SpaceX satellite Doge-1 to the moon on May 10, 2021 helped gain Dogecoin billions of dollars.

* Musk's tweet on May 19 2021– 'How much is that Dogecoin on the window'-- almost doubled the price of Dogecoin from $ 0.29 to $0.40 and Bitcoin fell below $40, 000 on the same day following the frantic sale of Doge.

* Musk's September 13 tweet 'Floki has arrived' with the pic of his Shiba Inu puppy, surged the price of Shiba Floki coins to nearly 958.9 and Floki Inu rose 60 per cent in 24 hours.

* The recent tweet on October 4, with a picture of Musk's puppy Floki on the hood of his Tesla car shot up the prices of Shib coins to 55 per cent and 22.13 per cent increase in Floki Inu's price.

Shiba Inu Coin (SHIB)

 Shiba inu (SHIB) is an Ethereum-based ERC-20 token that has risen in popularity this year, largely because of its dog-themed ecosystem, speculation on its price by retail investors and strong community engagement. The official Shib Twitter account, for example, has over 1.2 million followers – more than leading crypto companies such as Cardano, Kraken and Solana.

The digital asset was inspired by the Japanese breed of dog of the same name, which sparked a viral meme trend in 2013 and subsequently led to the creation of the infamous dogecoin cryptocurrency. Shiba inu, along with dogecoin and the hundreds of other pet-inspired digital assets, have become collectively known in the industry as “meme coins.”

Ordinarily, a meme coin offers owners little to no utility compared with more established cryptocurrencies such as bitcoin and ether. In the case of shiba inu, however, there seems to be a legitimate attempt by the development team to provide more value to SHIB holders, including launching a decentralized exchange in July.

Notably, the desire to provide more utility to users has seen the self-proclaimed “doge killer” become the second-most popular meme coin in the market. And although the market capitalization of dogecoin is three times that of shiba inu at press time, the underdog project has managed to create and build up a large community in less than two years.

Key features of shiba inu

So other than being another doggy-themed cryptocurrency, what is the shib coin all about?

The first notable thing about Shiba Inu is its total supply. A total of 1 quadrillion SHIB tokens were minted during its official launch in 2020. A quadrillion is a number followed by 15 zeros. Some 50% of the supply of shiba inu was locked in Uniswap SHIB/ETH liquidity pool – a decentralized exchange where users deposit pairs of assets into liquidity pools that other investors can trade against. That is known as an automated market maker system.

The other 50% of shib token’s supply was donated to Ethereum’s founder, Vitalik Buterin, who burned a vast majority of them by sending the tokens to a dead crypto wallet address. The remaining tokens (worth $1.2 billion at the time) were donated to an Indian COVID-19 relief cause and other charities.

The Shiba Inu universe also consists of a decentralized exchange, called Shibaswap, and two other tokens, “LEASH” and “BONE,”

Finally, the community is also championing a rescue campaign for Shiba Inu dogs. All you need to do is make purchases on Amazon through smile.amazon.com and select Shiba Inu Rescue Association (a 501(c)3 as your preferred nongovernmental organization). This will allow a percentage of your purchase to be donated to a cause focusing on helping Shiba Inu dogs in need.

Thursday, October 21, 2021

5分钟学投资 01 财务自由

 让你了解什么是财务自由

请订阅Youtube频道 https://www.youtube.com/channel/UCJy2siT-ElAOHiLuKeoCr2A 以观看每天更新全部周文强老师系列

Wednesday, October 20, 2021

What is NFT?


What is NFT?

NFT, or Non-Fungible Token, is a concept that is related to fungible tokens. If we compare it to the real world, fungible tokens are like currency: if you have $500 USD, you can divide it up, spend it in parts, get spare change, and continue to make more purchases with the change you receive. On the other hand, non-fungible tokens are unique and indivisible. Some examples could be: artworks, treasures in videogames, property deeds, or even certificates to prove wine provenance. When you trade a non-fungible token, you no longer own it, and since it is indivisible, there is no concept of spare change.

NFTs are issued on distributed ledgers on the blockchain. As such, as long as the ledger and the chain still exist, the record stating your NFT ownership will be intact. It will not be tampered with, removed, or disappear. When an NFT is issued, the contract will contain identifying information of the token including: the ID of the token, and a way to link to the assets it represents. These are the 2 main reasons why NFTs are optimal to prove a person’s ownership of an asset:

  1. The information is unalterable once it is on the blockchain
  2. NFT tokens are intrinsically unique, immutable, and indivisible

Similarly, NFT’s unique properties allow for it to be used in videogames to represent treasures or characters in the game. The most prominent example would be that of CryptoKitties. CryptoKitties is a blockchain game on Ethereum that allows players to buy, breed, collect and sell virtual cats. In the art world, NFTs can be applied to paintings, music copyrights, and various collectibles. A notable example would be encryption artist Beeple’s sale of their work: EVERYDAYS: THE FIRST 5000 DAYS, that was auctioned off for $69.34 million USD. NFTs are also commonly used in other industries in the form of digital certificates, identity authentication, and domain names.

So, how did the concept of NFTs come about? It started towards the end of 2017 when Dieter Shirley, CTO of CryptoKitties, released EIP-721 (Ethereum Implementation Proposal 721.) EIP-721 was different from ERC20 standard, which was very popular at the time and had highly sought-after ICO tokens. EIP-721 proposed, for the first time, tokens that were not interchangeable. Soon after, the concept of NFTs started to gain traction in different applications, including CryptoKitties. Nowadays, it is increasingly common to see NFT auctions hitting record numbers in the news.

Sunday, November 8, 2020

How to Calculate Return on Investment (ROI)


How to Calculate Return on Investment (ROI)

ROI is a way to measure an investment's performance. As you'd expect, it's also a great way to compare the profitability of different investments. Naturally, an investment with a higher ROI is better than an investment with a lower (or negative) ROI. Curious how to measure this for your own portfolio? Let's read on.


Introduction

Whether you're day trading, swing trading, or a long-term investor, you should always measure your performance. Otherwise, how would you know if you're doing well? One of the great benefits of trading is that you can rigorously measure how you're doing with objective metrics. This can greatly help eliminate emotional and cognitive biases. 

So, how is this useful? Well, the human mind tends to build narratives around everything as it tries to make sense of the world. However, you can't "hide" from numbers. If you're producing negative returns, something should be changed in your strategy. Similarly, if you feel like you're doing well but the numbers aren't reflecting that, you're probably a victim of your biases.

We've discussed risk managementposition sizing, and setting a stop-loss. But how do you measure the performance of your investments? And how can you compare the performance of multiple investments? This is where the ROI calculation comes in handy. In this article, we'll discuss how to calculate return on investment (ROI).


What is return on investment (ROI)?

Return on investment (ROI) is a way to measure an investment's performance. It also can be used to compare different investments.

There are multiple ways to calculate returns, and we'll cover some of them in the next chapter. For now, though, it's enough to understand that ROI measures the gains or losses compared to the initial investment. In other words, it's an approximation of an investment's profitability. Compared to the original investment, a positive ROI means profits, and a negative ROI means losses.

ROI calculation applies to not just trading or investment, but any kind of business or purchase. If you plan to open or buy a restaurant, you should do some number crunching first. Would opening it make sense from a financial perspective? Calculating an estimated ROI based on all your projected expenses and returns may help you make a better business decision. If it seems like the business would turn a profit in the end (i.e., have a positive ROI), it may be worth getting it started.

Also, ROI can help evaluate the results of transactions that already happened. For example, let's say you buy an old exotic car for $200,000. You then use it for two years and spend $50,000 on it. Now suppose that the car's price goes up on the market and you can now sell it for $300,000. Not only did you enjoy this car for two years, but it also brought you a sizable return on your investment. How much would that be exactly? Let's find out.


How to calculate return on investment (ROI)

The ROI formula is quite simple. You take the current value of the investment and subtract the original investment cost. Then, you divide this sum by the original cost of the investment.

ROI = (current value - original cost) / original cost

So, how much profit would you make by selling the exotic car?

ROI = (300,000 - 200,000) / 200,000 = 0.5

Your ROI is 0.5. If you multiply it by 100, you get the rate of return (ROR).

0.5 x 100 = 50

This means that you made a 50% gain on your original investment. However, you need to take into account how much was spent on the car to get the full picture. So, let's subtract that from the current value of the car:

300,000 - 50,000 = 250,000

Now, you can calculate ROI while taking into account the expenses:

ROI = (250,000 - 200,000) / 200,000 = 0.25

Your ROI is 0.25 (or 25%). This means that if we multiply your cost of investment ($200,000) by your ROI (0.25), we can find the net profit, which is $50,000.

200,000 x 0.25 = 50,000


The limitations of ROI

So, ROI is very easy to understand and brings a universal measure of profitability. Are there any limitations? Sure.

One of the biggest limitations of ROI is that it doesn't take into account the time period. Why does this matter? Well, time is a crucial factor for investments. There could be other considerations (like liquidity and security), but if an investment brings 0.5 ROI in a year, that's better than 0.5 ROI in five years. This is why you may see some talking about annualized ROI, which represents the investment returns (gains) you could expect over the course of a year.

Still, ROI won't take into account other aspects of an investment. A higher ROI doesn't necessarily mean a better investment. What if you can't find anyone willing to buy your investment and get stuck with it for a long period of time? What if the underlying investment has poor liquidity?

Another factor to consider is risk. An investment might have a very high prospective ROI, but at what cost? If there's a high chance that it goes to zero, or that your funds become inaccessible, then the prospective ROI isn't all that important. Why? The risk of holding this asset for a long time is very high. Sure, the potential reward could also be high, but losing the entire original investment is certainly not what you want.

Just purely looking at ROI won't give you insights into its safety, so you should consider other metrics as well. You could start by calculating the risk/reward ratio for each trade and investment. This way, you can get a better picture of the quality of each bet. In addition, some stock market analysts may also consider other factors when evaluating potential investments. These can include cash flows, interest rates, capital gains tax, return on equity (ROE), and more.